Overview
Overview developments in failure frequencies
(updated December 2024)
An extensive analysis of data covering the period 1970 to 2024 has lead to the following overview:
| Period | Interval | Number of incidents | Total system exposure ·1,000 km·yr | Primary failure frequency per 1,000 km·yr |
|---|---|---|---|---|
| 1970 – 2007 | 7th report, 38 years | 1,173 | 3,152 | 0.372 |
| 1970 – 2010 | 8th report, 41 years | 1,249 | 3,551 | 0.352 |
| 1970 – 2013 | 9th report, 44 years | 1,309 | 3,980 | 0.329 |
| 1970 – 2016 | 10th report, 47 years | 1,366 | 4,409 | 0.310 |
| 1970 – 2019 | 11th report, 50 years | 1,411 | 4,837 | 0.292 |
| 1970 – 2022 | 12th report, 53 years | 1,463 | 5,288 | 0.277 |
| 1983 – 2022 | 40 years | 998 | 4,613 | 0.216 |
| 1993 – 2022 | 30 years | 610 | 3,806 | 0.160 |
| 2003 – 2022 | 20 years | 379 | 2,754 | 0.138 |
| 2013 – 2022 | 10 years | 171 | 1,452 | 0.118 |
| 2018 – 2022 | 5 years | 74 | 736 | 0.101 |
Conclusions
- The EGIG database is a valuable source of information on European gas pipelines and pipeline incidents.
- EGIG has maintained and expanded the European Gas pipeline incident database. Nineteen gas transmission system operators in Europe now collect incident data on 150 thousand km of pipelines every year. The total exposure, which expresses the length of a pipeline and its period of operation, is 5.29 million km·yr.
- In the EGIG database 1,463 pipeline incidents are recorded in the period from 1970-2022.
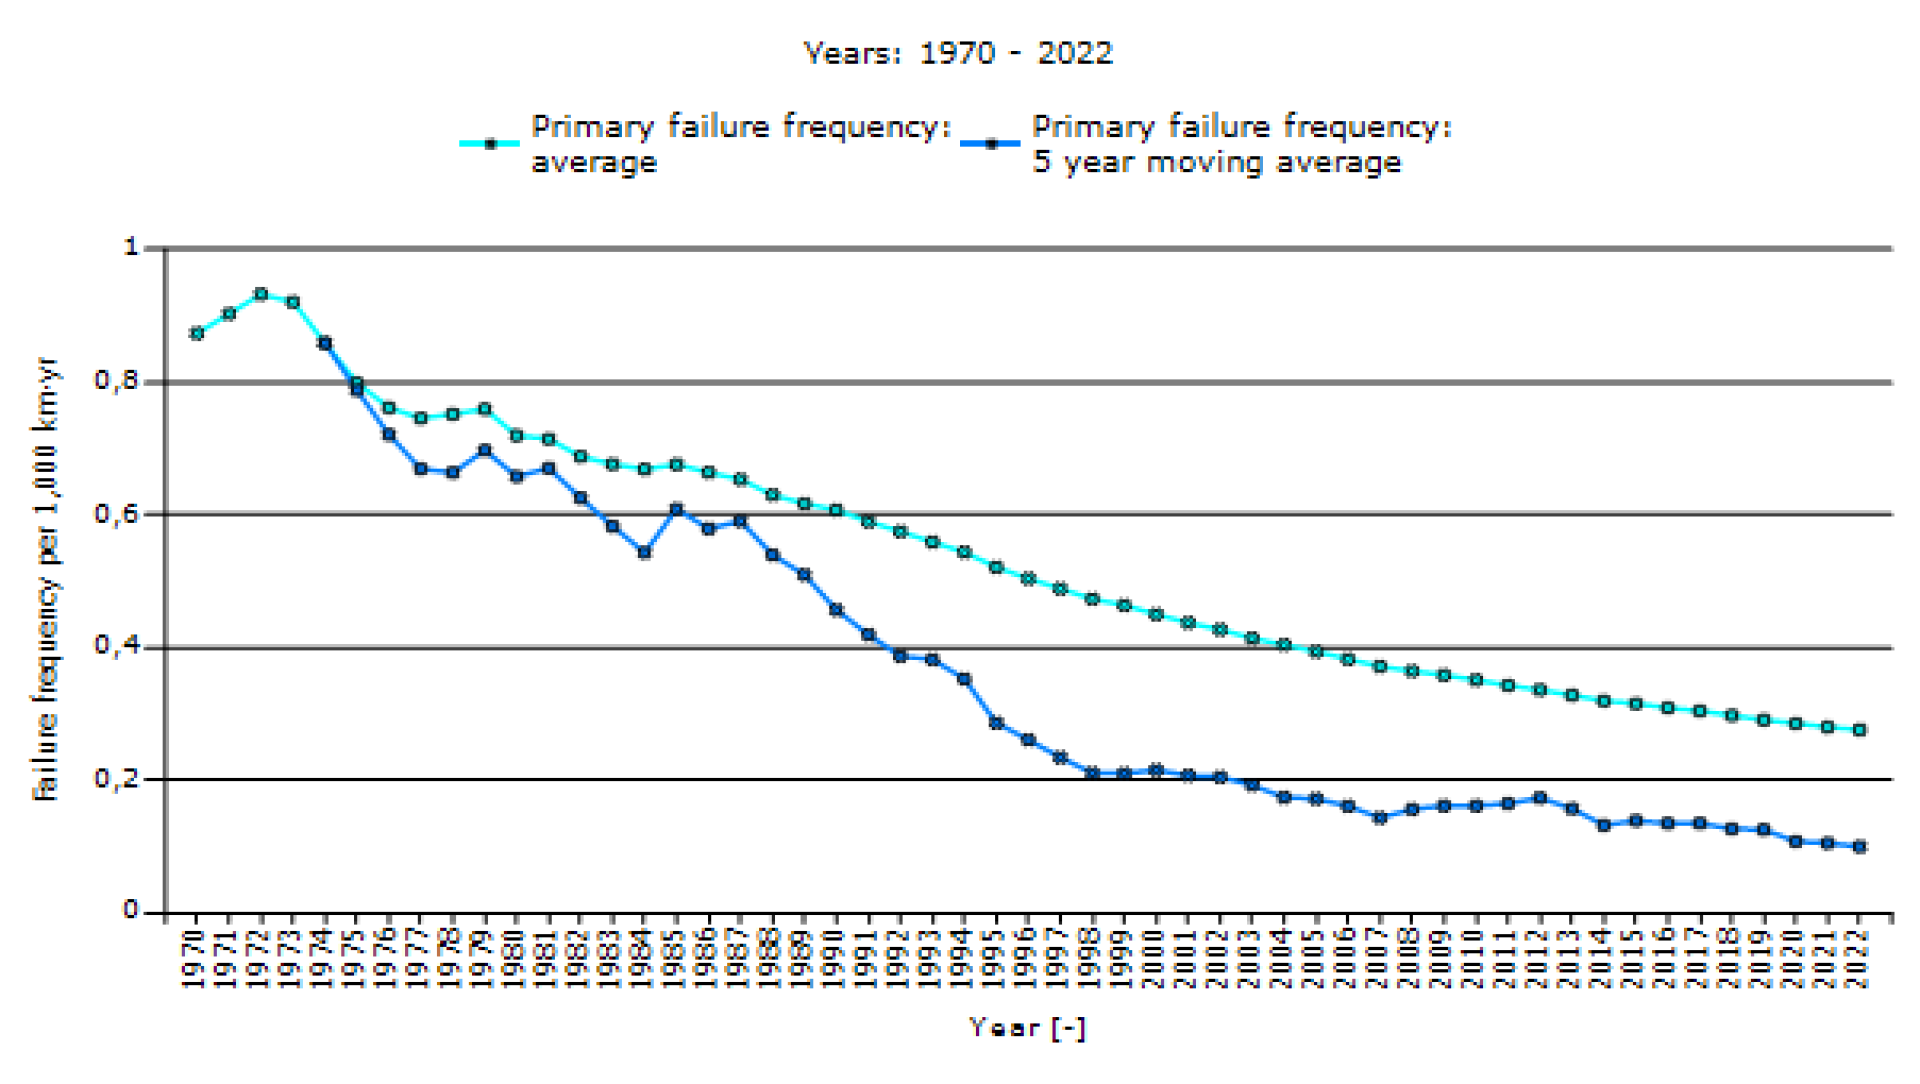
- The history of incidents collected in the database gives reliable failure frequencies. The overall failure frequency over the period 1970-2022 is 0.277 incidents per year per 1,000 km.
- The five year moving average failure frequency in 2022, which represents the average failure frequency over the past 5 years is 0.101 per year per 1,000 km.
- The five year moving average and overall failure frequency show a general downward trend with fluctuations over the years.
- Incidents caused by external interference and ground movement are characterised by potentially severe consequences. This emphasises the importance of measures taken by pipeline operators and authorities to prevent these incidents.
- Over the last 5 years, corrosion as a primary cause has the highest failure frequency followed by external interference that used to have the highest failure frequency up to and including the 11th EGIG report. The consequences of corrosion failure are typically pinholes, whereas consequences of external interference can be much more severe.
- Over the last ten years, corrosion, external interference, ground movement and construction defects, represent 25.7%, 22.8%, 19.3% and 17.5% respectively of the pipeline incidents reported.
Development Safety Performance